How to Read a Candlestick Chart
Each candle compresses four numbers into one shape. Understanding what it does and does not tell you prevents most beginner misreadings.
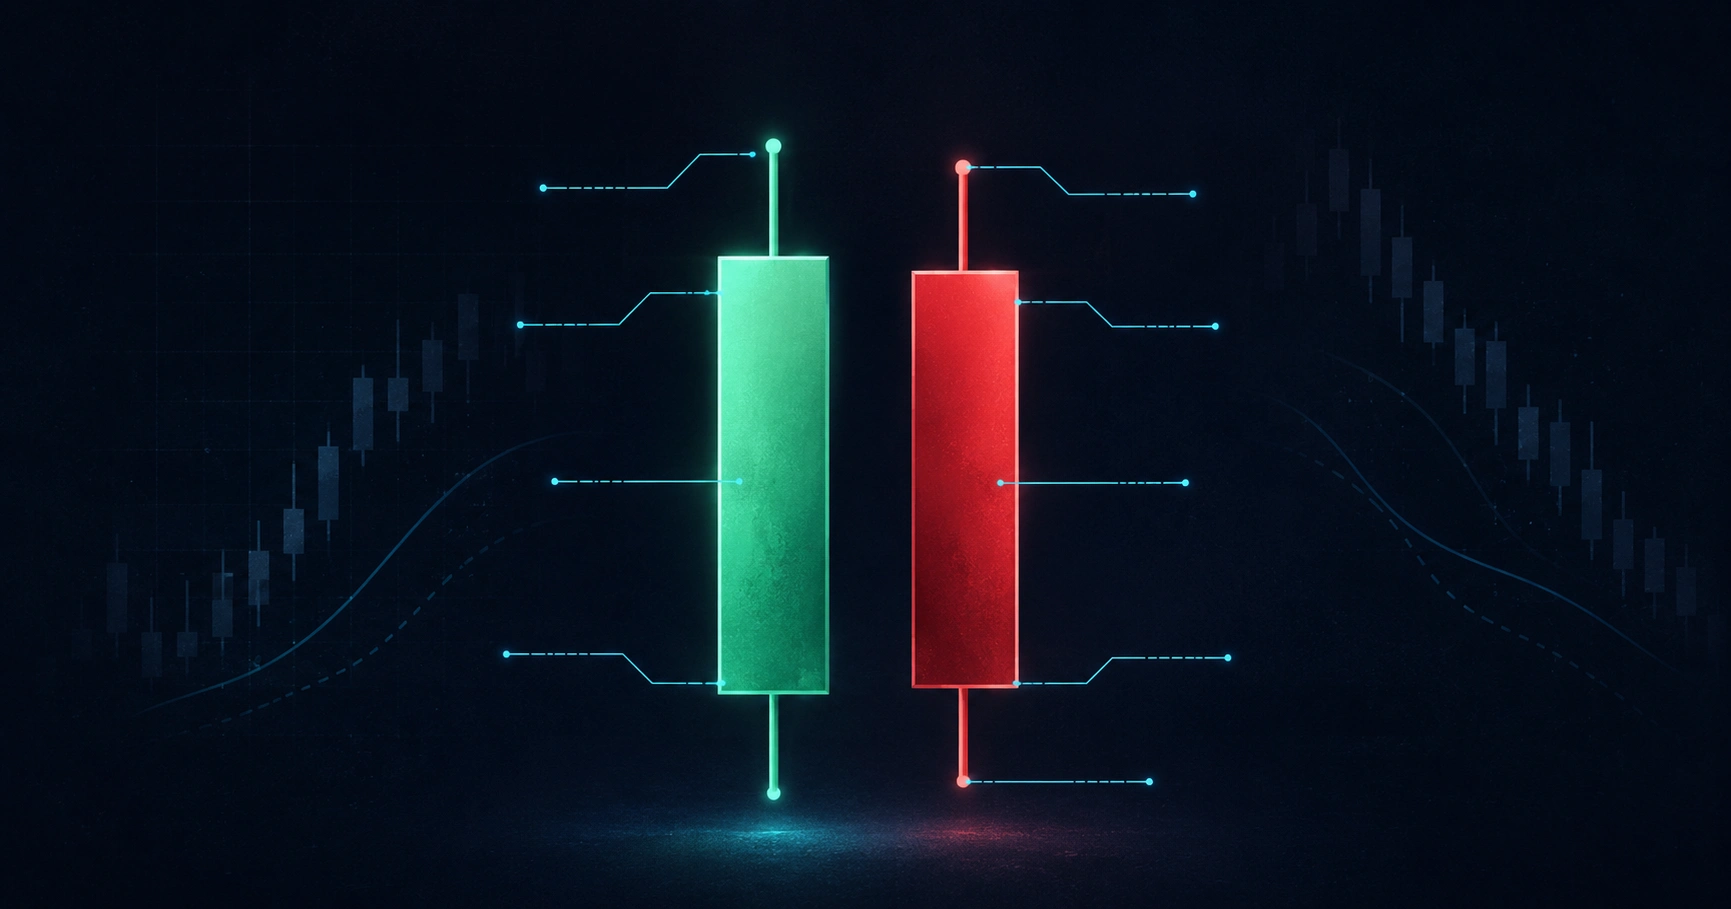
A candlestick encodes four prices for a period: open, high, low and close. That is all it contains. Everything else is interpretation.
The anatomy
- Body — the range between open and close. Filled or red when the close was lower; hollow or green when higher.
- Upper wick — from the body top to the high. Price went there and did not stay.
- Lower wick — from the body bottom to the low. Same in reverse.
A long body indicates one side dominated the period. A small body indicates indecision — price ended near where it started regardless of what happened in between.
What wicks tell you
Wicks are usually more informative than bodies, because they show rejected price levels. A long upper wick means buyers pushed price up and were overwhelmed before the close. That rejection is a real event in the order book.
The body shows who won. The wicks show where the fight happened.
Patterns worth knowing
- Doji — open and close nearly equal. Indecision, most meaningful after an extended move.
- Hammer — small body, long lower wick. Selling was absorbed.
- Shooting star — small body, long upper wick. Buying was absorbed.
- Engulfing — a body that completely covers the previous one. A shift in control.
- Inside bar — entirely within the previous candle's range. Compression, often preceding expansion.
The limitations that matter
Patterns without context are close to noise. A hammer in the middle of a range means very little; the same hammer at a level tested three times previously, on elevated volume, means considerably more.
Timeframe changes everything. A bearish engulfing on a five-minute chart is a minor event. On a weekly chart it may reflect a genuine shift in positioning.
And candles are backward-looking by definition. They describe what happened. Any predictive value comes from the behaviour they imply about participants, which is probabilistic and modest.
Sensible use
Treat candles as evidence about who is in control at a specific level, combined with volume and structure — not as standalone signals. Most traders who claim candlestick patterns do not work are testing them without context, which is the wrong test.
Educational content only. Not financial advice.
See the models in action
Reading about forecasting is one thing. Create a free account and get 5 AI predictions a month — no card required.
Start free