The Strategy Library: Templates, Not Prescriptions
Documented strategies with their historical characteristics, including the conditions in which each one performs badly.
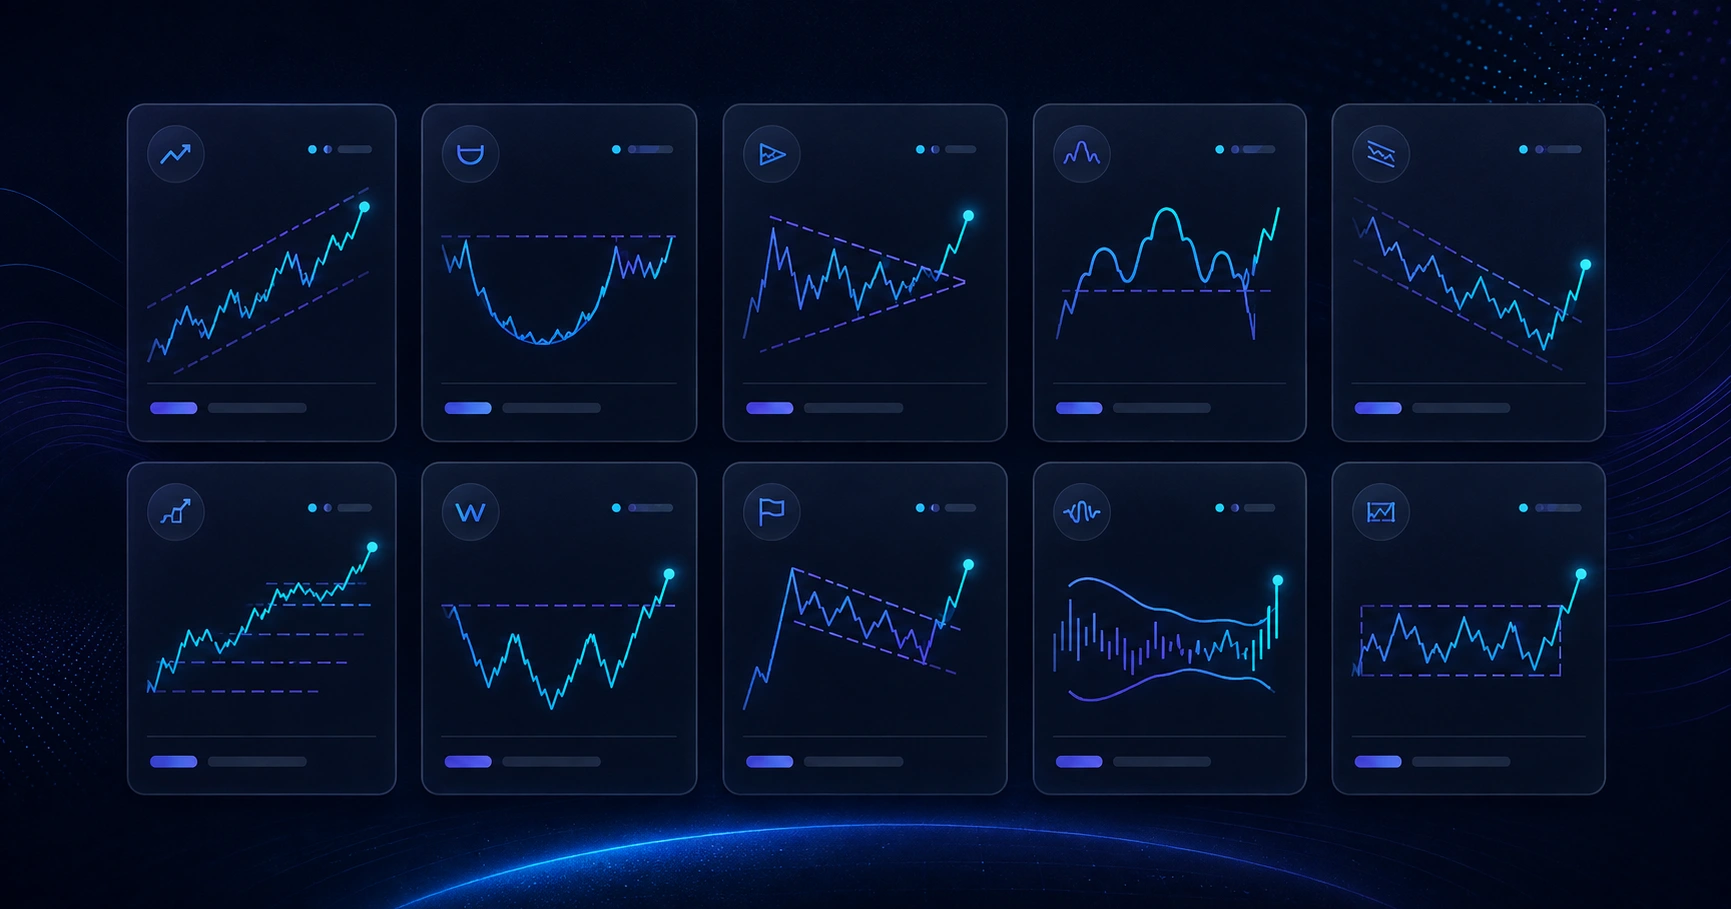
The strategy library documents established approaches with their historical characteristics attached. The intention is not to hand over a method that works, but to make the trade-offs of each one explicit.
What each entry describes
- Category — trend, momentum, mean reversion, breakout and so on.
- Suitable markets — whether it was developed for forex, equities, crypto or commodities.
- Difficulty — how much execution discipline it demands.
- Risk profile — the shape of its typical drawdowns.
- Historical characteristics — win rate, average return and maximum drawdown from testing.
How to read the metrics
Two numbers that look similar can describe completely different experiences. A 65% win rate with a 1:1 payoff is a different strategy from a 35% win rate with a 3:1 payoff, even where expectancy is comparable. The first feels comfortable and occasionally hurts badly; the second is uncomfortable most of the time.
Choose for the drawdown you can sit through, not the return you would like.
The maximum drawdown figure deserves the most attention. A strategy you abandon during a normal losing stretch produces a realised loss regardless of its long-run properties.
What the numbers do not tell you
Historical metrics come from testing over specific periods. They do not transfer automatically to different market conditions, different instruments, or different execution quality. Every figure should be read as "this is what happened then", not "this is what happens".
Costs also vary by broker and instrument. A strategy viable at institutional spreads may not be viable at retail ones, particularly at higher frequencies.
Using the library sensibly
Pick one approach and test it yourself before committing capital — on paper, over enough occurrences to mean something. Understand why it should work, because a strategy you cannot explain is one you will abandon at the first drawdown.
Resist collecting. Running six strategies badly is worse than running one properly, and switching between them after losses guarantees you experience every drawdown and none of the recoveries.
TradePredictor provides analytical tools for informational purposes only and does not provide financial advice. Historical strategy performance does not guarantee future results.
See the models in action
Reading about forecasting is one thing. Create a free account and get 5 AI predictions a month — no card required.
Start free