Drawdown Explained: The Number That Ends Accounts
Return is what people advertise. Drawdown is what determines whether you are still trading when the returns arrive.
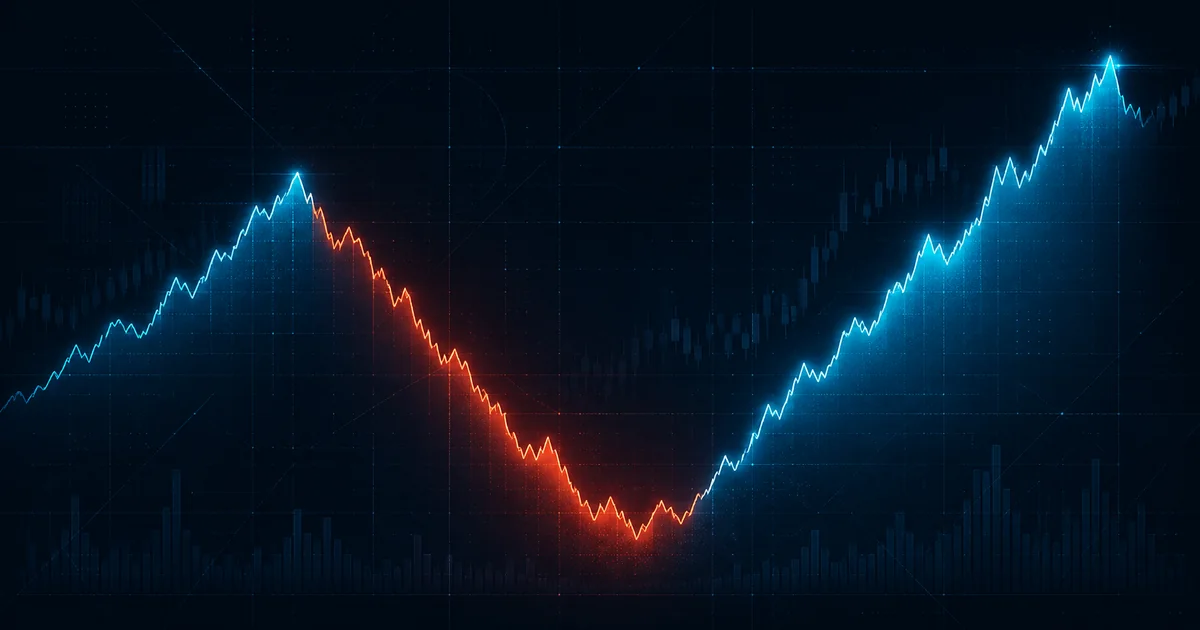
Drawdown is the decline from a peak in your account to the subsequent trough, expressed as a percentage. It is the most important risk number in trading and the least discussed in marketing material.
The recovery asymmetry
Losses compound against a shrinking base, so recovery requires a larger percentage than the loss:
- −10% needs +11%
- −20% needs +25%
- −33% needs +50%
- −50% needs +100%
- −66% needs +200%
- −90% needs +900%
Past roughly 50%, recovery stops being a matter of patience and becomes a matter of needing performance you may never have demonstrated.
The measures worth knowing
- Maximum drawdown — the worst peak-to-trough decline in the record.
- Average drawdown — more representative of routine experience.
- Drawdown duration — how long you spent below the previous peak. Often more psychologically punishing than depth.
- Time to recovery — how long getting back took.
Duration deserves particular attention. A 15% drawdown lasting three weeks is a different experience from a 15% drawdown lasting fourteen months, even though the number is identical.
Your historical maximum is not your maximum
Whatever your worst drawdown has been, assume the future holds something worse.
A backtest showing a 20% maximum drawdown means the worst outcome in that particular history was 20%. It is not a bound. Longer histories nearly always reveal deeper drawdowns, and planning around the historical figure as a ceiling is a common and expensive error.
The real reason drawdown matters
Not the arithmetic — the behaviour. Most abandoned strategies are abandoned during drawdown, frequently near the bottom. A trader who could have withstood 20% but sized for 10% will capitulate at exactly the wrong moment, converting a temporary decline into a permanent loss.
This is why the honest question is not "what is the maximum drawdown?" but "what drawdown can I actually sit through without changing my behaviour?" — and then sizing so the expected drawdown fits inside that.
Reducing it
Smaller position sizes are the direct lever and the most reliable. Diversifying across uncorrelated strategies helps, provided the correlation holds up under stress — correlations have a habit of converging to one exactly when diversification is needed.
Educational content only. Not financial advice. Trading involves substantial risk of loss.
See the models in action
Reading about forecasting is one thing. Create a free account and get 5 AI predictions a month — no card required.
Start free