How to Read the Fear and Greed Index
A sentiment gauge that is widely quoted and widely misused. It measures crowd positioning, not direction, and the difference matters.
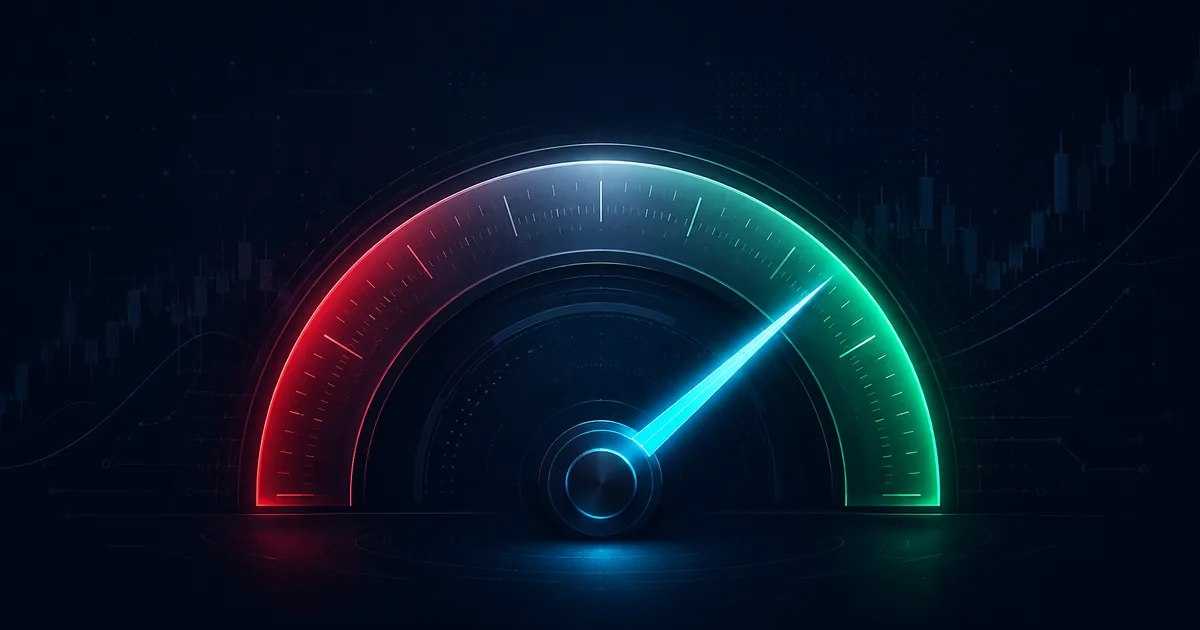
The Fear and Greed Index is one of the most quoted sentiment measures in markets and one of the most misread. It does not tell you where price is going. It tells you how crowded the current view is.
What it is actually built from
The crypto version and the equity version differ, but both blend several inputs into a single 0–100 reading. Typical components include:
- Volatility — current volatility against its recent average. Spikes read as fear.
- Momentum — price relative to a moving average. Extended rallies read as greed.
- Volume and market breadth — whether buying pressure is broad or narrow.
- Dominance or safe-haven demand — rotation towards assets people hide in.
- Surveys and social sentiment — self-reported and inferred positioning.
Because it aggregates, a single reading can be driven by very different underlying conditions. Two 25s can mean different things.
Why extremes matter more than the middle
Between roughly 40 and 60, the index is mostly noise. Its usefulness is concentrated at the tails, and the logic is positioning rather than prophecy: when almost everyone is already fearful, most of the selling has happened and there is less fuel left. When almost everyone is greedy, most of the buying has happened.
Extreme sentiment tells you the crowd is leaning heavily one way. It does not tell you when the lean corrects.
This is the critical caveat. Markets stay in extreme greed for months during strong trends. Selling because a gauge reads 80 has cost people a great deal.
How it is best used
As context, not trigger. A technical setup that appears while sentiment is at an extreme carries different implications than the same setup in a neutral market. Sentiment shapes how you interpret other evidence; it rarely stands alone.
It is also more informative when it moves fast. A shift from 70 to 30 in a week says something changed materially. A slow drift is far less meaningful.
Where it fails
The index is backward-looking by construction — every component derives from what has already happened. It cannot anticipate news. It also behaves differently across asset classes: crypto sentiment swings far more violently than equity sentiment, so thresholds are not transferable.
The honest summary
The Fear and Greed Index is a decent thermometer and a poor compass. It describes the emotional temperature of the market accurately. It says nothing reliable about what happens next.
Educational content only. Not financial advice. Trading involves substantial risk of loss.
See the models in action
Reading about forecasting is one thing. Create a free account and get 5 AI predictions a month — no card required.
Start free