The Sharpe Ratio for Traders
A measure of return per unit of risk, widely quoted and routinely misapplied to strategies that violate its assumptions.
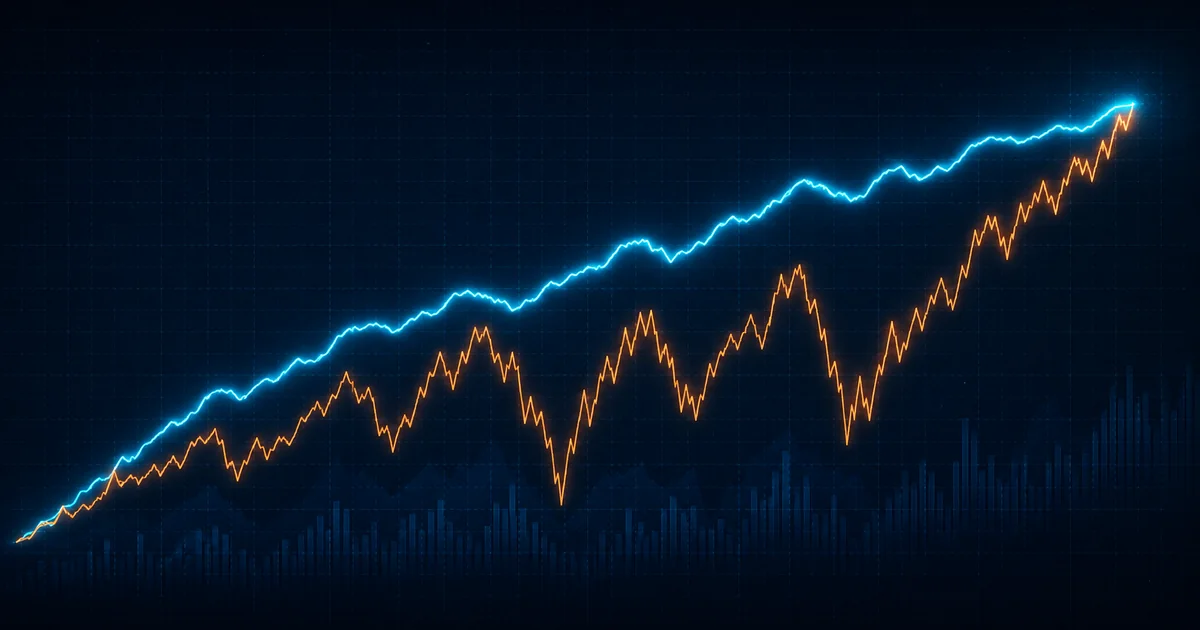
Two strategies both return 20% a year. One does it steadily, the other with wild swings. The Sharpe ratio is an attempt to say why the first is better.
What it calculates
Sharpe = (Return − Risk-free rate) ÷ Standard deviation of returns
Excess return over what you could have earned risk-free, divided by volatility. Higher is better, because it means you took less variability to get the same result.
Realistic values
- Below 0 — you underperformed cash.
- 0 to 1 — where most strategies genuinely sit.
- 1 to 2 — good, and rarer than backtests suggest.
- Above 2 — excellent, and sustained over years by very few.
- Above 3 — treat as a bug report until independently verified.
Backtested Sharpe ratios above 3 almost always indicate leakage, overfitting, or unmodelled costs. Reality has a way of compressing them.
Its blind spots
It penalises upside volatility
Standard deviation treats a large gain and a large loss identically. A strategy with occasional huge winners is punished for exactly the behaviour that makes it profitable — which is why trend-following funds often show unimpressive Sharpe ratios while performing well.
It assumes returns are normally distributed
Financial returns have fat tails. Extreme events occur far more often than a normal distribution predicts, so Sharpe systematically understates the risk of strategies exposed to them.
It can be gamed
Selling options produces a beautiful Sharpe ratio right up until it produces a catastrophe.
Strategies that collect small premiums and occasionally lose enormously show low volatility for long periods. Sharpe rewards them handsomely until the tail arrives.
Better measures for some cases
- Sortino — identical, but only counts downside volatility. More appropriate when upside swings are the point.
- Calmar — return divided by maximum drawdown. Directly addresses the risk traders actually experience.
- Omega — considers the full return distribution rather than the first two moments.
Practical use
Sharpe is most useful for comparing similar strategies over the same period. It is least useful in isolation or across very different return profiles. And it must be annualised consistently — a monthly Sharpe multiplied incorrectly will flatter a strategy considerably.
Educational content only. Not financial advice.
See the models in action
Reading about forecasting is one thing. Create a free account and get 5 AI predictions a month — no card required.
Start free